Learning Objectives
- Benefits of using Gridfox to manage your Sales Pipeline
- Configuring Boards to display key information for your Sales Team
An Introduction to Board Screens
Boards, sometimes known as Kanban Boards, are a great way to visualise the status of various items simultaneously.
By grouping items into rows and columns, you can quickly track an item through various stages and get a picture of the flow of work.
Boards display records as a card, where the cards can be divided up into columns. Optionally, these columns can then be further divided into rows.
Using Boards in your Sales Team
Given Boards allow you to see an overall picture of a group of Records, they make a great choice of tool for visualising and managing your sales pipeline.
The sales team can get an at a glance view of all of their opportunities, allowing everyone to keep on top of who is working on what and where each opportunity is up to in the sales process. Cards can be quickly moved around the Board, ensuring that there is continous visiblity of the latest state of all items.
To read about other use cases for Boards, take a look at the Overview Board Tutorial or scroll through our full list of Board Tutorials.
Setting up Tables for your Sales Process
This tutorial will show you how to create a Sales Opportunity Tracker Board in Gridfox. The first step is to set up the required Tables and Fields so that you can store information about your opportunities.
Creating a Company Table
In the model we will set up in this tutorial, opportunities will be linked to a company and there may be multiple opportunities for the same company. Start by creating a Table for Companies.
- Open up a Gridfox Project, or create a new one
- In either the Screen Builder or the Table Builder, create a new Table called Companies
- Add a Text Field called ‘Name’
- Add an Icon field called ‘Logo’
- Save the new Table, setting the Reference Field for the Table as ‘Name’
If you view the new Company Table in the Screen Builder, it should show as below:

If you would like to store additional information about the Companies in your Project, add in more Fields to the Table.
Creating an Opportunity Table
Now a Table can be created to store information about the Opportunities.
- Create a new Table, using either the Screen Builder or the Table Builder
- Name the new Table ‘Opportunities’
-
Add the following Fields to the Opportunities Table:
- Text Field called Description
- User Field called Owner
- Money Field called Value
- List Field called Probability with List Items ‘High’, ‘Medium’ and ‘Low’
-
List Field called Stage with List Items ‘Lead’, ‘Engaged’, ‘Scoping’, ‘Quoting’ and ‘Closed Won’
You can adapt these stages to match your internal sales process
- Save the new Table, choosing a new Auto Counter as the Reference Field
- Link the Table to the Company Table, ensuring Company has been set as the parent of the Opportunity Table i.e. A Company can have multiple Opportunities
If you view your full Project model in the Table Builder, it should show as below:

Add any other Fields that you require to store additional information about the opportunities.
Inviting the Team to the Project
To allow you to assign Opportunities to your team members, they will need to be invited to the Project.
- Select the Permissions tab
- Create or customise any Groups to ensure your users have the correct permissions
- Invite the Users to the Project
You can optionally assign a colour to each of your invited Users. This will show up on the Board once it is configured.
Adding Records to the Tables
Add some records into both the Company and Opportunity Tables so that you Board can illustrate the data for you.
- Select the User Mode tab
- Create some Companies, making sure to upload some logos as these will be used on the Board later
- Add some Opportunity Records for the Companies, assigning them to your invited team members
You are now ready to start configuring the Board.

Creating a new Board
- Select the Screen Builder tab
- Click Add New in the navigation bar
- Select Board (Kanban)
- Enter a Screen Name - we can call this ‘Sales Pipeline’
- Click Add
You now have a brand new Board Screen. Before it can be saved, it needs to be configured.

Configuring a Board Screen
Firstly we need to choose the data that will show on the Board. To give an overview of the state of all opportunities in your pipeline, we will want to show the opportunity records grouped by their status.
- In Select Table choose Opportunities
- In Column Settings choose List
- In Select List for Columns choose Stage
- In Display Fields select Description, Value and Owner
- In Select Icon select Company.Logo
- Click Save
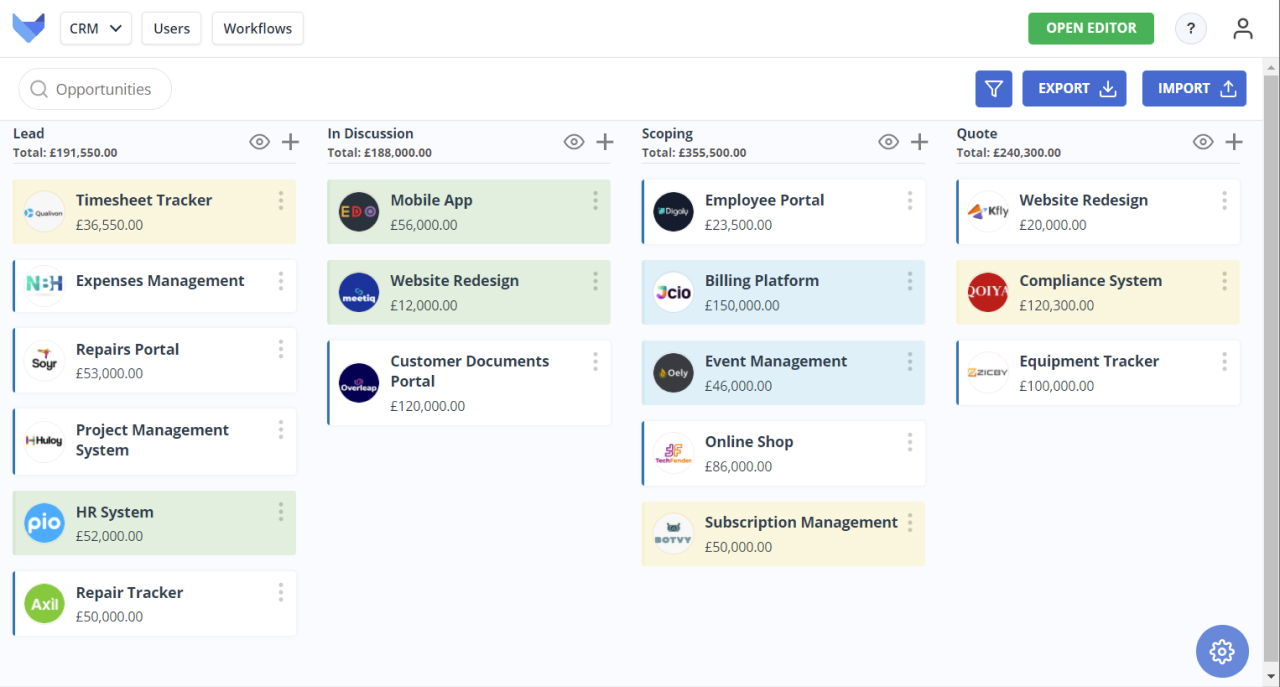
You will now have a configured Board showing all of your opportunity Records, grouped by their status.

Additional Configuration Options
To help understand the value of your pipeline, it may be useful to see the total value of all opportunities in a certain status. You can configure the Board to show the total value of a field on all Records in the column.
- Ensure you are in Builder Mode and select the Sales Pipeline Screen
- In Total Field select Value
- Click Save
Now at the top of each of your Board columns, you can see the total value of all Records in that column.

A probability field was added to the opportunity Table. It may be useful to see at a glance which opportunities have a high probability of progressing. You can use the colour settings on the Board to achieve this.
- Select the Screen Builder tab
- Select the Opportunities Table
- Set a colour for the ‘High’ list item in the Probability Field
- Select the Sales Pipeline Board
- In Colour Settings select List
- In Select List Field select Probability
- Click Save
Any opportunities which were marked as high probability will now be highlighted in your chosen colour on the Board.

When your Users are using the Sales Pipeline Board, as the volume of opportunities increases they may wish to filter the Records that are shown to them. As a Project Admin, you can specify which Fields on the Opportunity Table that they can filter by.
- Select the Screen Builder tab
- Select the Sales Pipeline Board
- In Select Filter Fields choose Company, Description, Owner, Probability and Stage
- Click Save
These fields will now show as options when a user opens the filter menu.

Using the Sales Pipeline Board
Now that you have setup and configured the Sales Pipeline Board, it is ready for your Users to use.
Managing Cards on the Sales Pipeline Board
The status of an opportunity can be updated by dragging and dropping the card from one column to another.

To view the details of an existing opportunity, or to edit the details of an opportunity, click the card on the Board to be taken to the Record.

New cards can be created on the Board by clicking the plus icon in the appropriate status column.

To give your sales team quick access to view their opportunities, you can create a saved filter.
- Open the filter menu
- In the Owner field select ‘@Me’
- Click Save As
- Give the filter a name and click Save
The filter will show up in the navigation bar for all of your team to use. It will show them all opportunities assigned to themselves.

Summary
Your Sales Pipeline Board is now configured and ready for you and your team to use. Continue to make any adjustments that are required, such as showing more information on cards or adjusting the stages that your opportunities work through.