Most project plans fail for one simple reason.
Not because the tasks were wrong.
Not because the deadlines were unrealistic.
But because the same people were quietly overbooked across multiple projects.
You can have the cleanest Gantt chart in the world and still miss every deadline if your team is double-booked.
This is the Multi-Project Blindspot, and it’s one of the biggest causes of delivery delays in modern teams.
The hidden problem behind “perfect” project plans
Here’s a scenario that plays out every week in growing teams:
Project A has a perfect plan. The Gantt chart shows Steve writing documentation on Tuesday.
Project B also has a perfect plan. The Gantt chart shows Steve fixing a critical bug on Tuesday.
Both project managers are happy.
Both timelines look healthy.
But Steve is only one person.
On Tuesday, Steve is forced to choose.
By Wednesday, both projects slip.
This happens because traditional project management tools are built around projects, not people.
When you work inside a single project board, you only see that project’s reality. You do not see that:
• Your lead developer is assigned across four initiatives
• A designer is part-time
• A key contributor is on holiday later in the week
The plan looks right. The workload is not.
To scale delivery, you have to stop managing tasks in isolation and start managing real human capacity.
That is where a Global Timeline View changes everything.
What is a Global Timeline View?
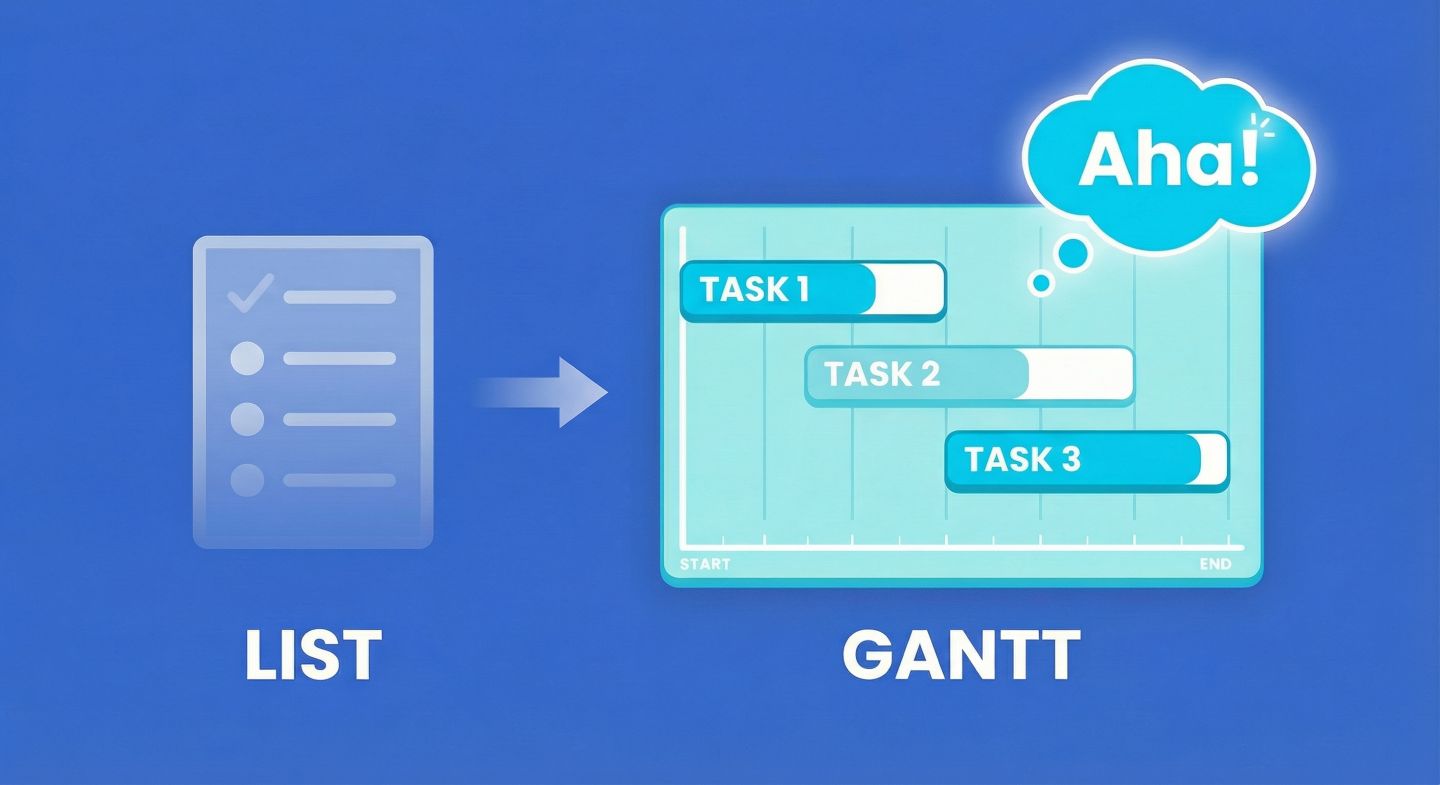
A Gantt chart answers:
“In what order should work happen?”
A Global Timeline answers:
“What is everyone actually working on across the business?”
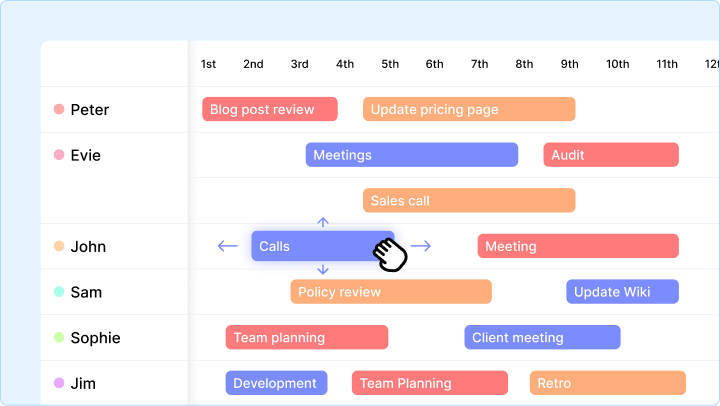
Instead of showing tasks by project, it flips the perspective:
Each row represents a person.
Every task from every project is pulled into one live schedule. You see exactly how work stacks up across your entire team in real time.
Think of it as operational visibility for modern work.
Why global visibility is the missing layer in resource scheduling
Most delivery problems are not planning problems.
They are capacity conflicts.
A Timeline View exposes the issues traditional tools hide.
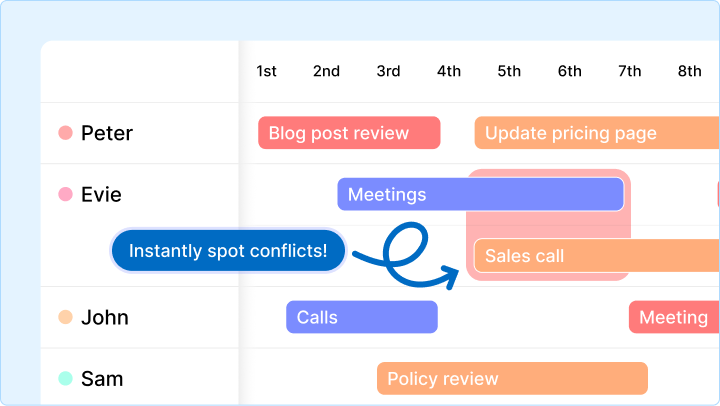
1. You see double-booking instantly
In task lists, overlapping work looks harmless.
In a Timeline View, conflicts are visual.
When multiple tasks stack on the same person on the same day, you can spot overload in seconds.
No spreadsheets.
No reports.
No surprises at the end of the week.
Just reality.
2. Your schedules finally reflect real availability
Work does not happen 24/7.
Timeline View factors in:
• Working hours
• Part-time schedules
• Holidays and non-working days
Unavailable time is clearly greyed out.
If a task lands in a non-working period, you see immediately that it cannot be completed as planned. This forces realistic scheduling instead of optimistic guesswork.
3. You can allocate work based on capacity, not guesswork
When urgent work appears, most teams rely on Slack messages like:
“Is anyone free?”
A Global Timeline answers that question instantly.
The open space on the schedule shows who has capacity right now. You can assign work with confidence instead of interrupting the whole team.
Global Timeline vs Gantt chart: You need both
Gantt charts are still essential. They help you design the flow of work.
Global Timelines help you manage the reality of people.
Use:
Gantt charts for planning logic
What depends on what. What comes first. What follows.
Timeline View for operational delivery
Who is overloaded. Who is available. Where conflicts exist.
One shows structure.
The other ensures execution.
High-performing teams use both.
Who benefits most from a Global Timeline View?
This approach becomes essential when:
Agencies and consultancies
Teams move between multiple clients daily and resource conflicts are constant.
Shared services teams
Design, QA, DevOps, marketing, and support serve multiple projects at once.
Operations and delivery leaders
Your success is not one project. It is consistent throughput across the organisation.
If your people contribute to more than one initiative, you need global visibility.
The strategic shift: From task tracking to capacity management
Most tools help you track work.
Very few help you manage human capacity at scale.
As organisations grow, delivery stops being about creating better task lists and starts being about balancing workload intelligently.
A Global Timeline enables:
• Fewer missed deadlines
• Less burnout
• Better utilisation
• Faster response to change
Most importantly, it replaces hope with clarity.
Ready to see your real schedule?
If deadlines keep slipping despite good project plans, the issue is rarely the tasks themselves. It is the hidden conflicts between them.
A Global Timeline View lets you finally see:
✔ Who is overloaded
✔ Where work clashes
✔ Who has capacity
✔ What will actually get done
If you want to experience how global resource visibility works in practice, book a free walkthrough and see your workflow mapped in real time.
👉 Get started here: Get Started