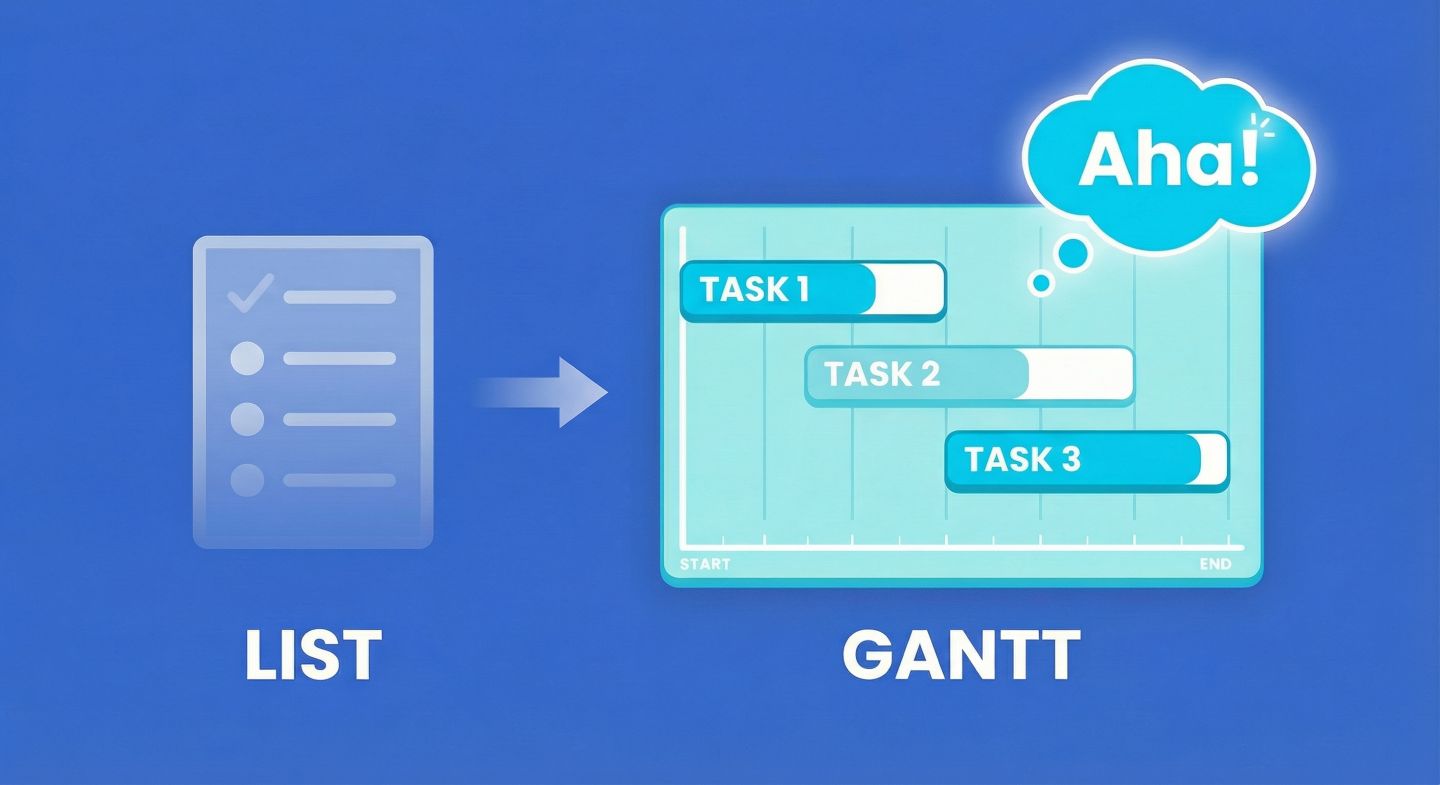
In our previous posts, we covered what a Gantt chart is and how to build a basic one.
That gets you a visual roadmap. But professional project management isn’t just about drawing a map; it’s about handling change.
- What happens when the design phase runs late?
- How do you organise 50 tasks across 5 different project phases?
- How do you reassign work without clicking into 20 different records?
This post covers the “Pro” features in Gridfox Gantt View—Dependencies, Grouping, and Inline Editing—that turn a static picture into a dynamic engine.
1. Dependencies: The Domino Effect
The defining feature of a real project schedule is Dependencies. This is the logic that says, “You can’t build the roof until you’ve built the walls.”
In Gridfox, you configure this via Gantt Settings > Configure Dependencies.
You’ll need a “Self-referencing relationship” on your Task record (e.g., a field called “Dependent On” that links a task to another task). Once that is set, you can choose how Gridfox handles time shifts.
The 3 Dependency Modes (Choose your style)
Gridfox offers three modes, because not every project moves the same way.
1) Strict (The “Train Carriage” Approach)
In Strict mode, tasks are locked together.
- How it works: If you move Task A forward by 2 days, Task B (and C and D) moves forward by exactly 2 days.
- Best for: Manufacturing or tight construction schedules where the gap between tasks must remain constant.
2) Flexible (The “Bumper Car” Approach)
This is the most popular setting for agile teams.
- How it works: It ensures tasks don’t overlap, but it doesn’t force them to move unless they have to.
- Scenario: If you push Task A into Task B’s start date, Task B will move to make room. But if you finish Task A early, Task B stays where it is (it doesn’t automatically pull back).
- Best for: Knowledge work, software development, and marketing campaigns.
3) None (Visual Only)
- How it works: Gridfox draws the lines between bars, but moving one task does not affect the others.
- Best for: High-level roadmaps where you want to show relationships but don’t want the software auto-calculating dates.
Dependency Types
Gridfox supports the standard industry logic types:
- FS (Finish-to-Start): Task B starts when Task A finishes (Standard).
- SS (Start-to-Start): Task B starts when Task A starts.
- FF (Finish-to-Finish): Task B finishes when Task A finishes.
- SF (Start-to-Finish): Task B cannot finish until Task A starts (Rare, but supported).
2. Grouping: Organising the Chaos
If you have more than 20 tasks, a flat list looks like spaghetti. Grouping organises your timeline into collapsible sections.
In the toolbar, click Group By.
You can group by Parent or Grandparent records.
Example: The “Phased” Project
Imagine you have a Projects table and a Tasks table.
- Select Group By: Project.
- Now, you see a header for “Website Redesign” containing all its tasks, and a separate header for “Mobile App Launch”.
Example: The “Sprint” View
If you link tasks to Sprints:
- Select Group By: Sprint.
- You can instantly see if “Sprint 1” is overloaded compared to “Sprint 2”.
Pro Tip: You can collapse groups to hide completed phases and focus only on active work.
3. Display Fields & Inline Editing: The “Spreadsheet” Power
Sometimes you need to see more than just the Task Name in the sidebar. You might need to see Priority, Budget, or Assignee alongside the bar.
Click the Display Fields button in the toolbar.
- Check the boxes for the fields you want to see (e.g., Priority, % Complete).
- These columns appear in the sidebar to the left of your timeline.
Why this is a game changer
These fields are Inline Editable.
You don’t need to click into the record to update it. You can treat the left side of your Gantt view like an Excel spreadsheet.
- Look at the timeline.
- See a clash.
- Click the “Priority” column in the sidebar and change “High” to “Low”.
- Click the “Assignee” column and swap “Sam” for “Alex”.
It’s the speed of a spreadsheet with the intelligence of a Gantt chart.
Summary: Which setup is right for you?
You now have the full toolkit. Here is how we recommend starting:
The “Lightweight” Setup (Start here)
- Dependencies: None (or Flexible)
- Grouping: None
- Completed Field: Enabled (for easy ticking off)
The “Project Manager” Setup
- Dependencies: Flexible (Finish-to-Start)
- Grouping: By Project or Phase
- Labels: Assigned To
- Display Fields: Priority, Status
The “Construction/Event” Setup
- Dependencies: Strict (to maintain exact timing)
- Grouping: By Stage
- Milestones: Enabled (to track the “Go Live” date)
Ready to schedule?
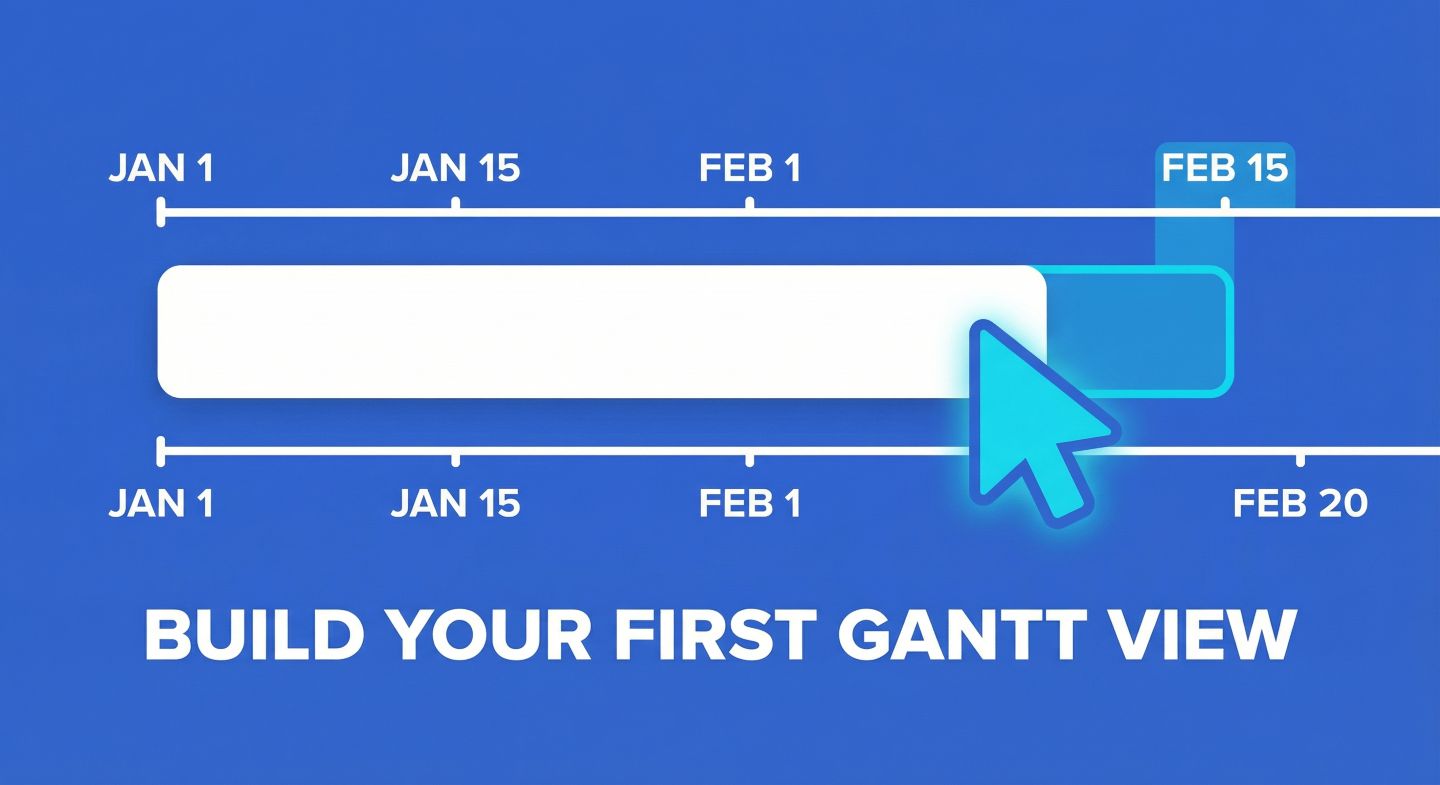
You’ve learned the concept, built the view, and mastered the advanced settings. The only thing left to do is put your data into Gridfox and see what your timeline actually looks like.
Go to your Project, click Add View > Gantt, and take control of your schedule.
If you have questions about complex dependencies or specific setups, our team is always ready to help at support@gridfox.com.