Many people avoid Gantt charts because they think they are “heavy” to build. They picture expensive software, hours of configuration, and complex manuals.
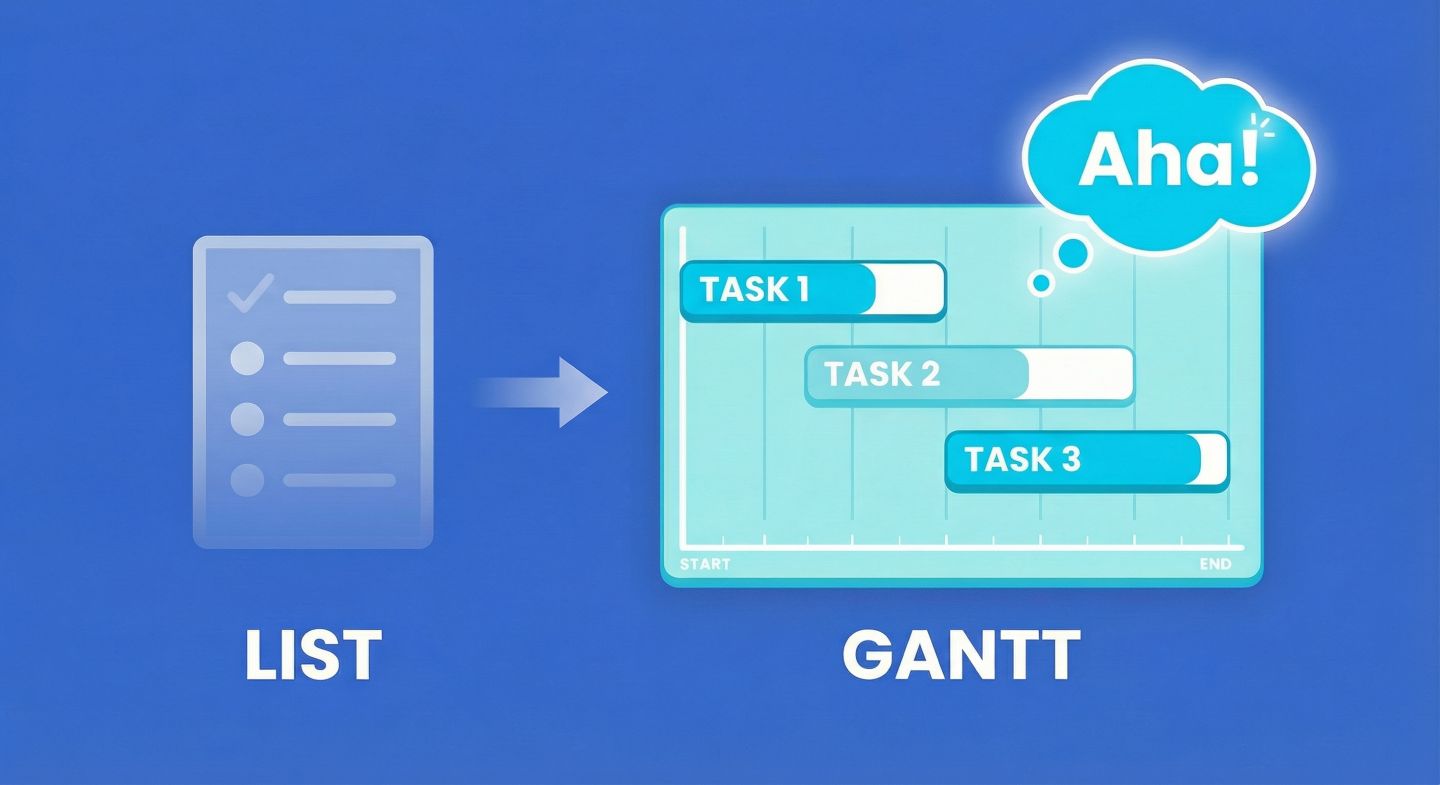
In Gridfox, a Gantt view is just a window into data you already have.
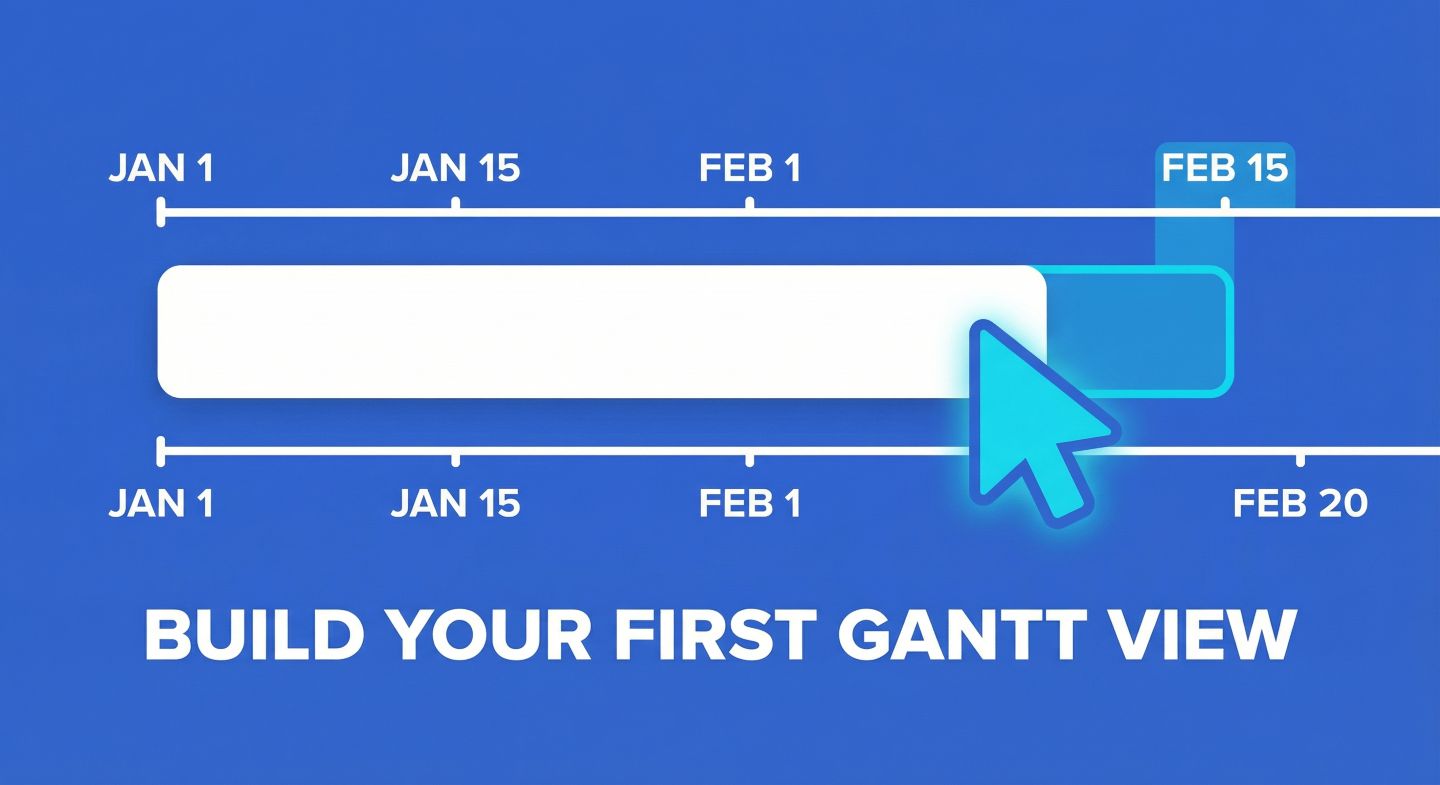
If you have a list of tasks with dates, you are 90 seconds away from a visual schedule. Here is how to build it, step-by-step.
Step 1: Check your ingredients
Before clicking “Add View”, make sure your Grid (Table) has the basics. You need three fields:
- Start Date: (Date Field) - When the task begins.
- End Date: (Date Field) - When the task finishes.
- Title: (Text or ID Field) - The name of the task.
Tip: If you don’t have an End Date yet, you can create one quickly, or just use a formula to add days to the Start Date.
Step 2: Add the Gantt View
- Open your project sidebar.
- Click Add View.
- Select Gantt.
- Click Next.
You will see the Gantt View Setup screen. This is where you map your fields.
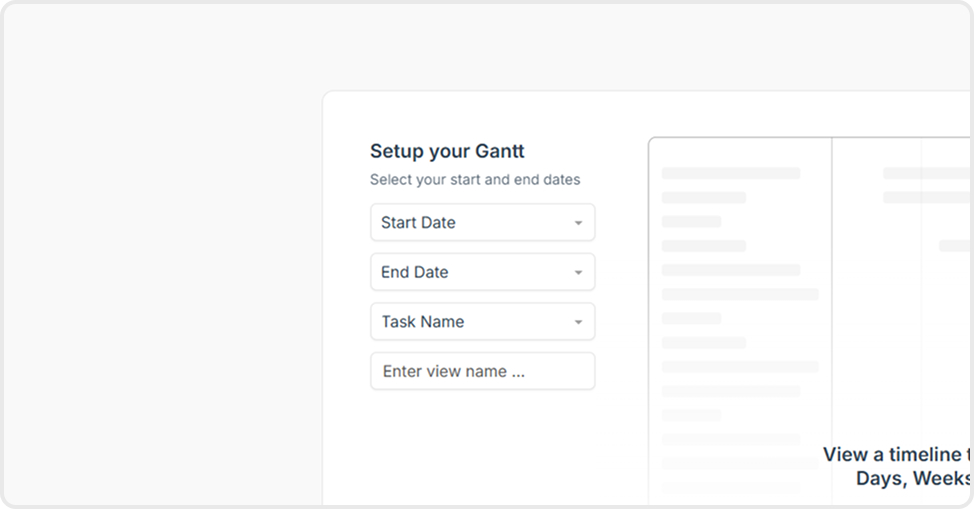
- Start Date: Select your start date field.
- End Date: Select your end date field.
- Title: Select the field that names the task (e.g., “Task Name”).
Click Next.
Congratulations, you have a timeline! But right now, all the bars look the same. Let’s make them useful.
Step 3: Upgrade with Gantt Settings
At the top of your new view, click the Gantt Settings button (the cog icon) in the toolbar.
This menu is where you turn a basic timeline into a management dashboard.
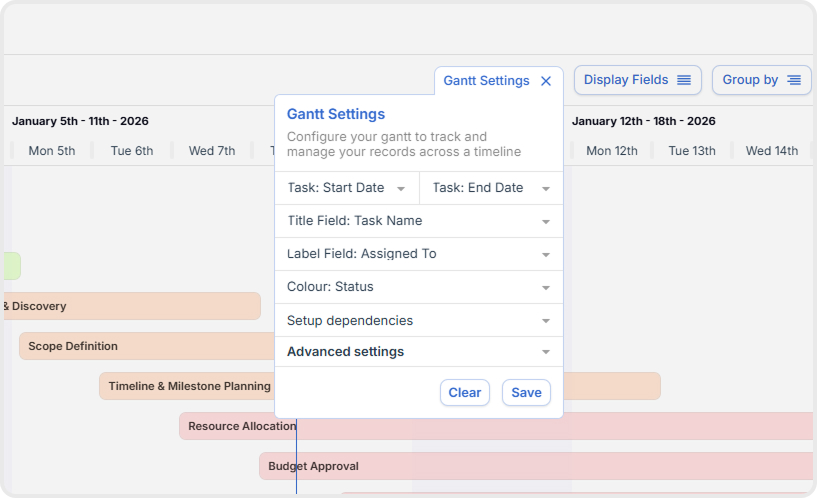
1. Colour code your status
By default, all bars might be blue. That’s boring and hides risk.
- Find the Colour setting.
- Select your Status field (must be a List Field).
Now, your Gantt chart inherits the colours from your status dropdown.
- Green bars: Done
- Amber bars: In Progress
- Red bars: Blocked
You can now assess the “health” of your project just by glancing at the colours.
You can also try setting the colour to a User field like Assigned To!
2. See “Who” with Labels
The Title of the task appears in the sidebar list (on the left), but looking back and forth between the list and the bar is annoying.
- Find the Label Field setting.
- Select Assigned To (or User/Owner).
Now, the name of the person doing the work appears inside the bar on the timeline. You can instantly spot if “Sam” has five overlapping bars (that’s a burnout risk!).
3. One-click updates with Completed Field
Usually, to mark a task “Done”, you have to open the record, find the status dropdown, change it, and save.
In Gridfox Gantt, you can do this directly on the chart.
- Find the Completed Field.
- Select your Status field.
- Gridfox will ask which status counts as “Completed” (e.g., select “Done”).
The result: Every bar on your timeline now has a small checkbox. Tick the box on the bar, and the record updates to “Done” instantly.
Sometimes you want to see the full list of details; other times you just want the big picture.
In Gantt Settings, use the toggles:
- Show Sidebar: Turn this off to give the timeline 100% of the screen width (great for presentations).
- Show Milestones: If you have records with zero duration (same start and end date), enabling this turns them into “Diamonds” on the chart—perfect for visualising deadlines or launches.
Step 5: Inline Editing (Change dates without opening records)
You don’t need to open a record to reschedule it.
- Move a task: Click and drag the center of the bar to shift the dates.
- Extend a task: Click and drag the edge of the bar to change the duration.
If you have the Display Fields button in the toolbar, you can also add columns to the sidebar (like Priority or Department) and edit them inline, just like a spreadsheet.
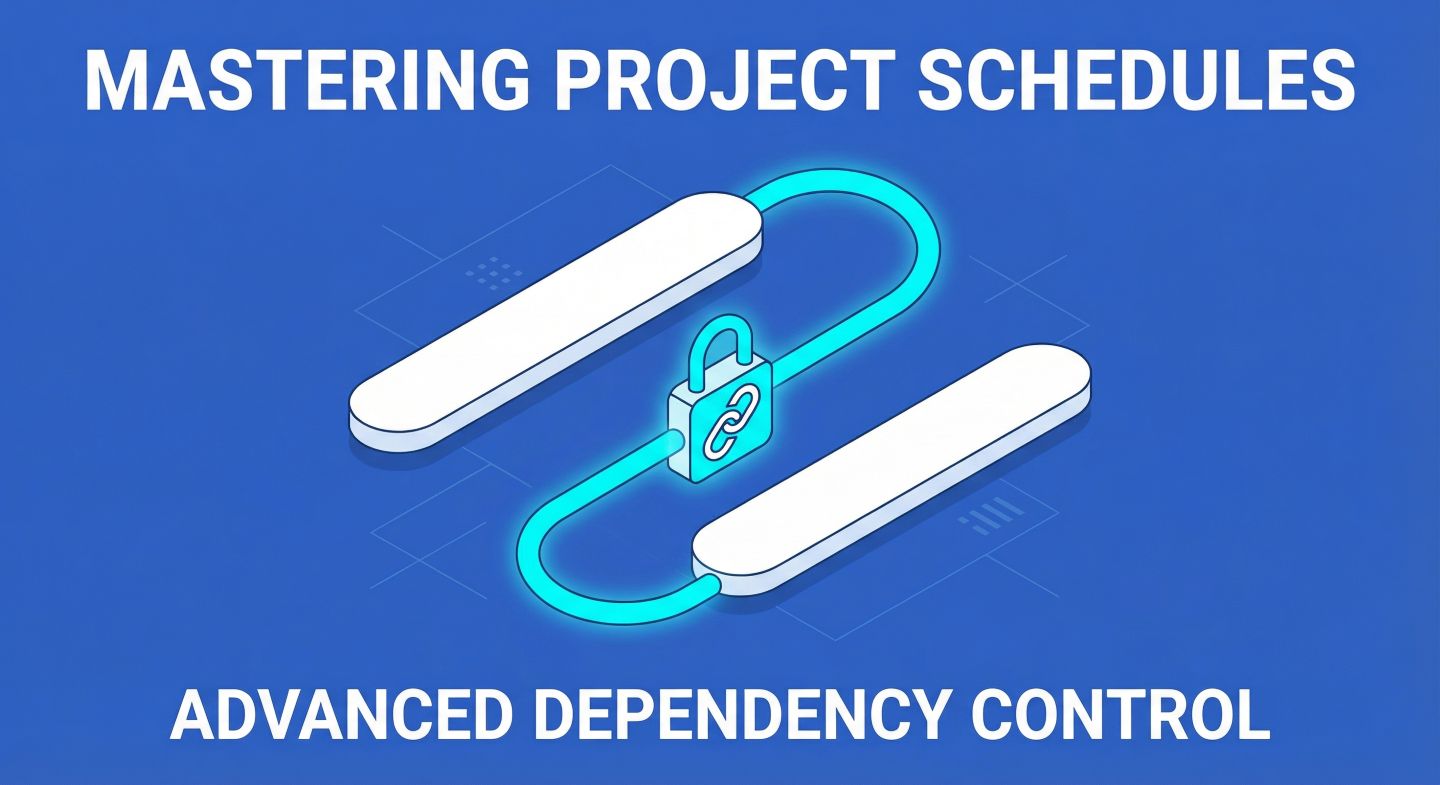
What’s missing? (Dependencies)
You might be wondering: “What happens if I move a task that other tasks are waiting for?”
Right now, nothing. The other tasks stay put.
To make them move automatically, you need Dependencies. Gridfox supports three modes: Flexible, Strict, and None. This is the powerhouse feature for serious project managers, and it’s exactly what we will cover in the final post of this series.
Next up: Mastering Project Schedules: Dependencies, Grouping, and Inline Editing.