Over the course of twelve months, we have fundamentally transformed our platform to deliver greater flexibility, performance, and collaborative capabilities for organisations across the United Kingdom and beyond.
This year, our development team has been guided by a singular vision: to provide small and medium-sized enterprises with the powerful, customisable work management tools they need, without the complexity typically associated with enterprise software. From the introduction of cross-project relationships to the launch of collaborative documentation and pivot tables, every feature release has been designed to help your teams work more efficiently and make better-informed decisions.
In this comprehensive review, we’ll examine the most significant developments of 2025, organised by quarter, and explore how these enhancements can benefit your organisation’s workflows and productivity.
Q1 2025: Building the foundation
The first quarter of 2025 established the groundwork for a year of substantial platform improvements, with particular emphasis on project visualisation, data management, and formula capabilities.
January: Enhanced Gantt charts and dashboard intelligence
We commenced 2025 with significant improvements to our Gantt chart functionality and dashboard experience.
Gantt chart milestones and dependencies
Project managers can now add milestones directly within Gantt views, providing clear visual markers for critical project dates and deliverables. The addition of self-referencing capabilities enables teams to create complex task dependencies within a single project structure, whilst the configurable “completed field” option allows organisations to define completion criteria according to their specific requirements.
Intelligent dashboard management
Dashboard users now benefit from the ability to save filters across an entire dashboard, eliminating the need to reconfigure filter settings each time you access your analytics. Combined with our new streamlined editing approach—which removes the requirement for a dedicated “edit mode”—dashboard management has become significantly more efficient.
Enhanced formula capabilities
For organisations leveraging Gridfox’s formula functionality, January’s release introduced E and Pi as available constants, expanding the mathematical precision available for complex calculations. Additionally, formulas can now be utilised as filter conditions within highlight rules, enabling more sophisticated conditional formatting across your data views.
Data import improvements
The import data function received a comprehensive upgrade, including a relocated global button for improved accessibility and inline editing capabilities during the import process. These enhancements streamline the process of bringing external data into your Gridfox projects.
February marked a substantial expansion of view options and data processing capabilities.
The new list view
We introduced the List View, providing teams with an additional method for displaying and interacting with their data. This view type is particularly well-suited to organisations that require a clean, linear presentation of records without the visual complexity of grid or board formats.
Workflow automation enhancements
Workflow filters now support the @me filter condition, enabling automated processes to reference the current user dynamically. This capability is particularly valuable for organisations implementing personalised task assignments and notifications. Furthermore, the send email workflow action now supports multi-select user fields as recipient options, facilitating more sophisticated communication workflows.
Comprehensive formula function library
February’s release significantly expanded our formula capabilities with the introduction of multiple mathematical and text functions:
Mathematical functions:
- STDEV_P and STDEV_S for statistical analysis
- MOD for remainder calculations
- MIN and MAX for value comparisons
- SIGN, ROUND, ROUND_UP, and ROUND_DOWN for numerical precision
Text functions:
- CONTAINS and CONTAINS_REGEX for string matching
- JOIN for concatenating values
- LENGTH for character counting
- REPLACE, REPLACE_REGEX, REPLACE_ALL, and REPLACE_ALL_REGEX for string manipulation
- LEFT, RIGHT, and MID for substring extraction
Custom date formatting
Organisations can now specify custom formatting for date and datetime fields, ensuring date presentations align with regional preferences and business requirements.
March: Record templates
March delivered some of the year’s most requested features.
Record templates
The record templates feature enables teams to create standardised record configurations that can be saved and applied to new records instantly. This capability significantly reduces data entry time for organisations that frequently create similar records, such as project briefs, client onboarding documentation, or recurring task structures. We further enhanced this feature by enabling record templates to save and apply associated files.
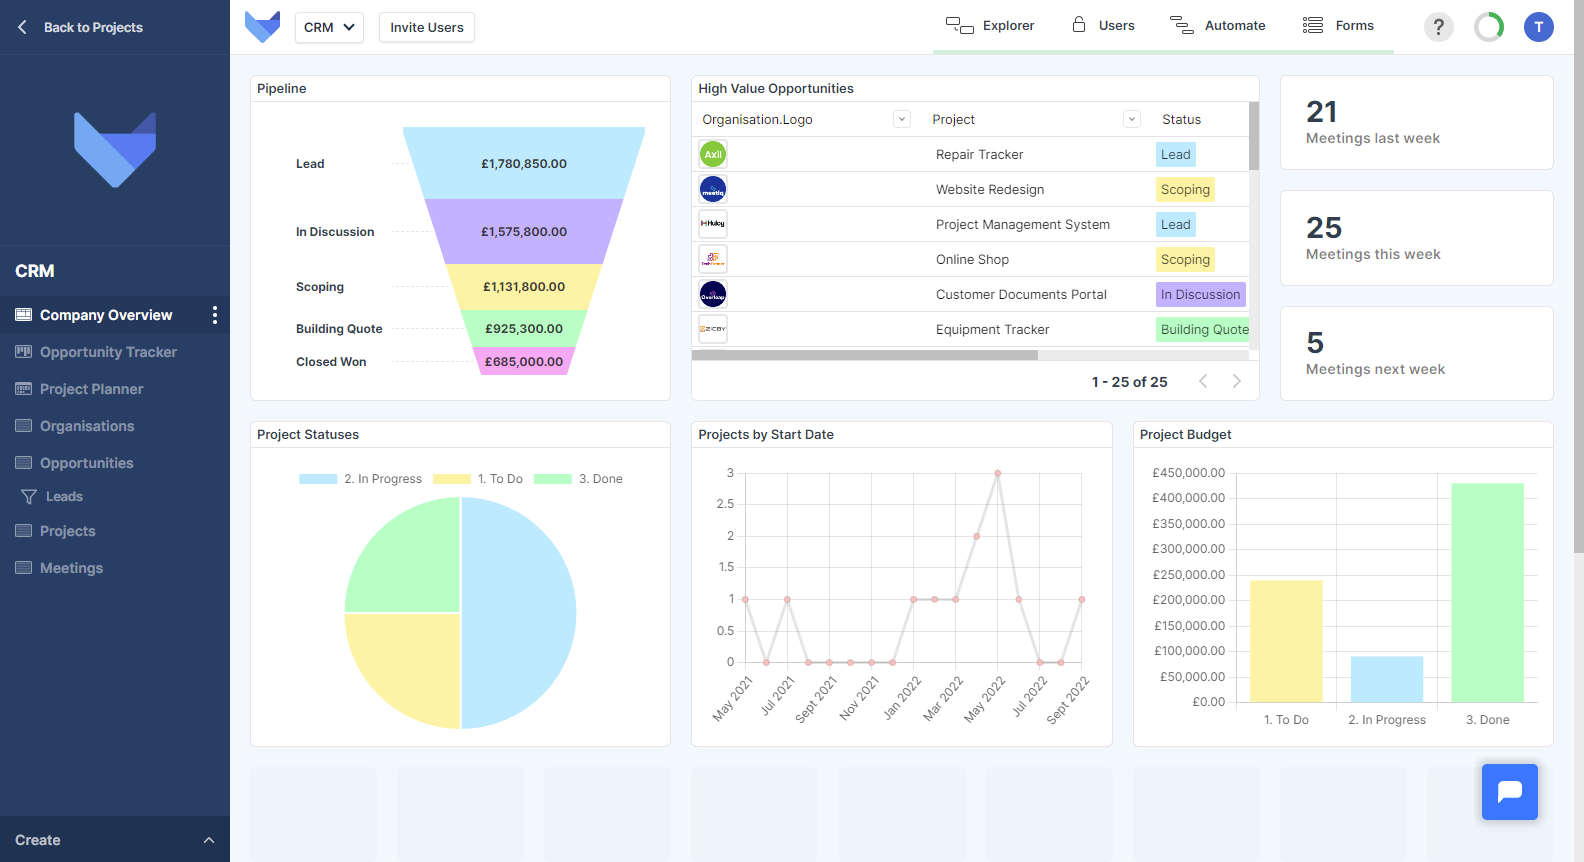
Interactive chart navigation
March introduced click-through functionality across multiple view types, enabling users to navigate from record grids, funnel charts, and number tiles directly to the underlying data. This drill-down capability transforms dashboards from static reporting tools into interactive analytical environments.
Progress bars for percentage fields
Percentage fields now display as visual progress bars, providing immediate comprehension of completion status, utilisation rates, or any other percentage-based metrics your organisation tracks.
Version history with diff view
Rich text fields now include comprehensive version history with a difference view, enabling teams to track changes over time and understand how documentation has evolved. This feature is invaluable for organisations maintaining audit trails or collaborative content development.
IF function and chart improvements
The introduction of the IF function in formulas enables conditional logic within calculations, whilst charts received a new quarter time period option for date-based grouping, improving financial and quarterly reporting capabilities.
Additional improvements:
- Email field type for validated email address storage
- Project administrators can now invite users directly from Settings
- Enhanced “Not empty” filter condition for additional field types
- Simple dashboard export functionality
- Configurable Gantt dependency types
- Edit and create views now appear as overlays for improved navigation
Q2 2025: Cross-project collaboration
May: Cross-project relationships and Xero integration
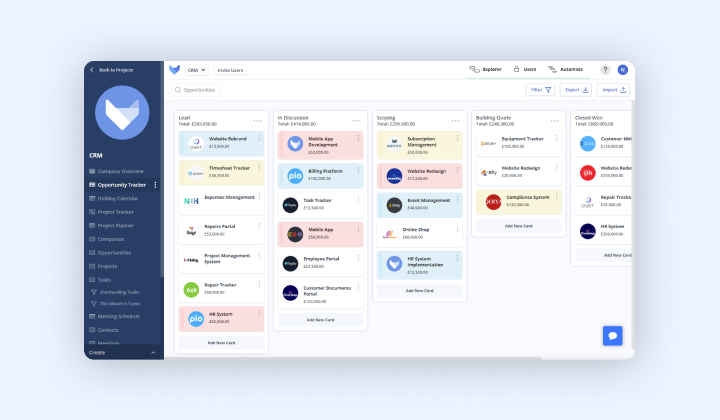
May introduced one of the year’s most transformative capabilities: cross-project relationships.
Cross-project relationships
Organisations can now create relationships between tables residing in different projects, fundamentally changing how data can be connected across departmental or functional boundaries. This feature enables scenarios such as:
- Linking sales opportunities to resource planning projects
- Connecting marketing campaign data with financial reporting
- Referencing shared client records across multiple operational projects
Cross-project relationships maintain the security and permission boundaries of each project whilst enabling the data connectivity modern organisations require.
Xero integration
For organisations utilising Xero for financial management, our new workflow integration enables automated data synchronisation between Gridfox and your accounting platform. This integration supports streamlined invoice generation, expense tracking, and financial reporting workflows.
Enhanced formula nesting
Formula capabilities received another substantial upgrade with the ability to build longer nested formulas, enabling more sophisticated calculations and data transformations within a single formula field.
Extended chart interactivity
Building upon March’s improvements, click-through functionality was extended to pie, bar, and line charts, completing the interactive dashboard experience.
The third quarter focused on performance optimisation and the introduction of comprehensive resource management capabilities.
July delivered substantial improvements to platform performance and user productivity.
Introducing My Work
The My Work feature represents a fundamental shift in how individual team members interact with their assigned tasks across projects. Accessible from the top-right dropdown menu, My Work provides a unified view of all tasks assigned to the current user, regardless of which project those tasks reside in.
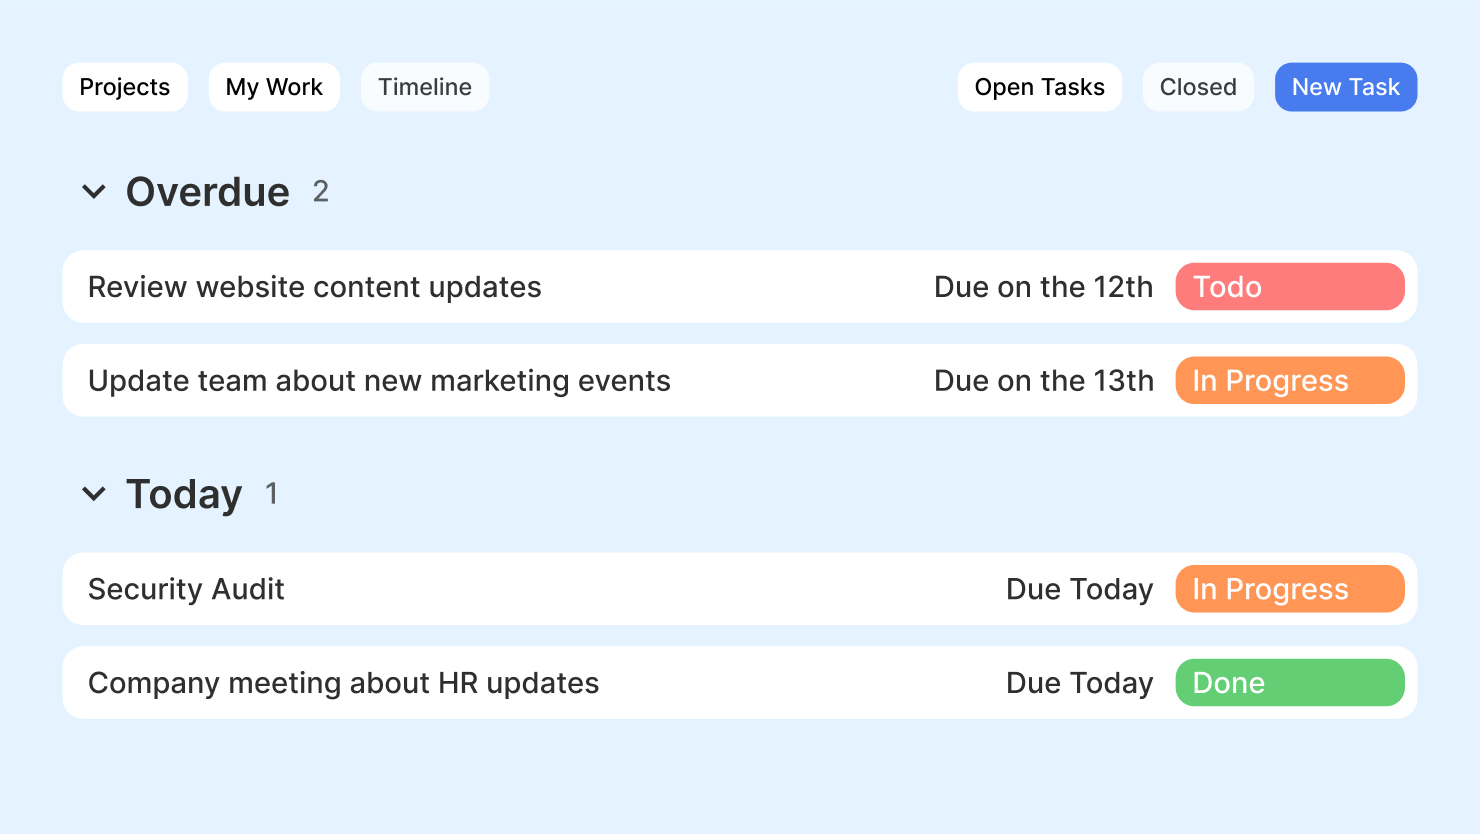
This feature is particularly valuable for team members who contribute to multiple projects simultaneously, providing a single location to review, prioritise, and manage their workload.
10x formula performance improvement
We delivered a greater than tenfold improvement to formula calculation performance. For organisations utilising complex formulas across large datasets, this enhancement translates to significantly faster page loads, more responsive editing experiences, and improved overall platform responsiveness.
Gantt chart performance optimisation
Gantt charts now perform efficiently when displaying over 2,000 records, enabling enterprise-scale project visualisation without compromising user experience.
AI project generation upgrade
Our AI-powered project generation feature now utilises ChatGPT 4.1, delivering improved accuracy and reliability when generating project structures from natural language descriptions.
Additional improvements:
- Simplified configuration for Kanban and Calendar views
- “Is empty” filter condition for date and datetime fields
- Many-to-many field import capability
August: User-created project templates
August introduced the ability for users to create and share their own project templates.
User-created project templates
Organisations can now save their existing project structures as templates, enabling rapid replication of proven project configurations across teams and departments. This feature accelerates new project setup and ensures consistency in how similar projects are structured.
Persistent unsaved changes
When switching between view modes on create and edit screens, any unsaved changes are now automatically preserved. This improvement prevents accidental data loss and streamlines the record editing experience.
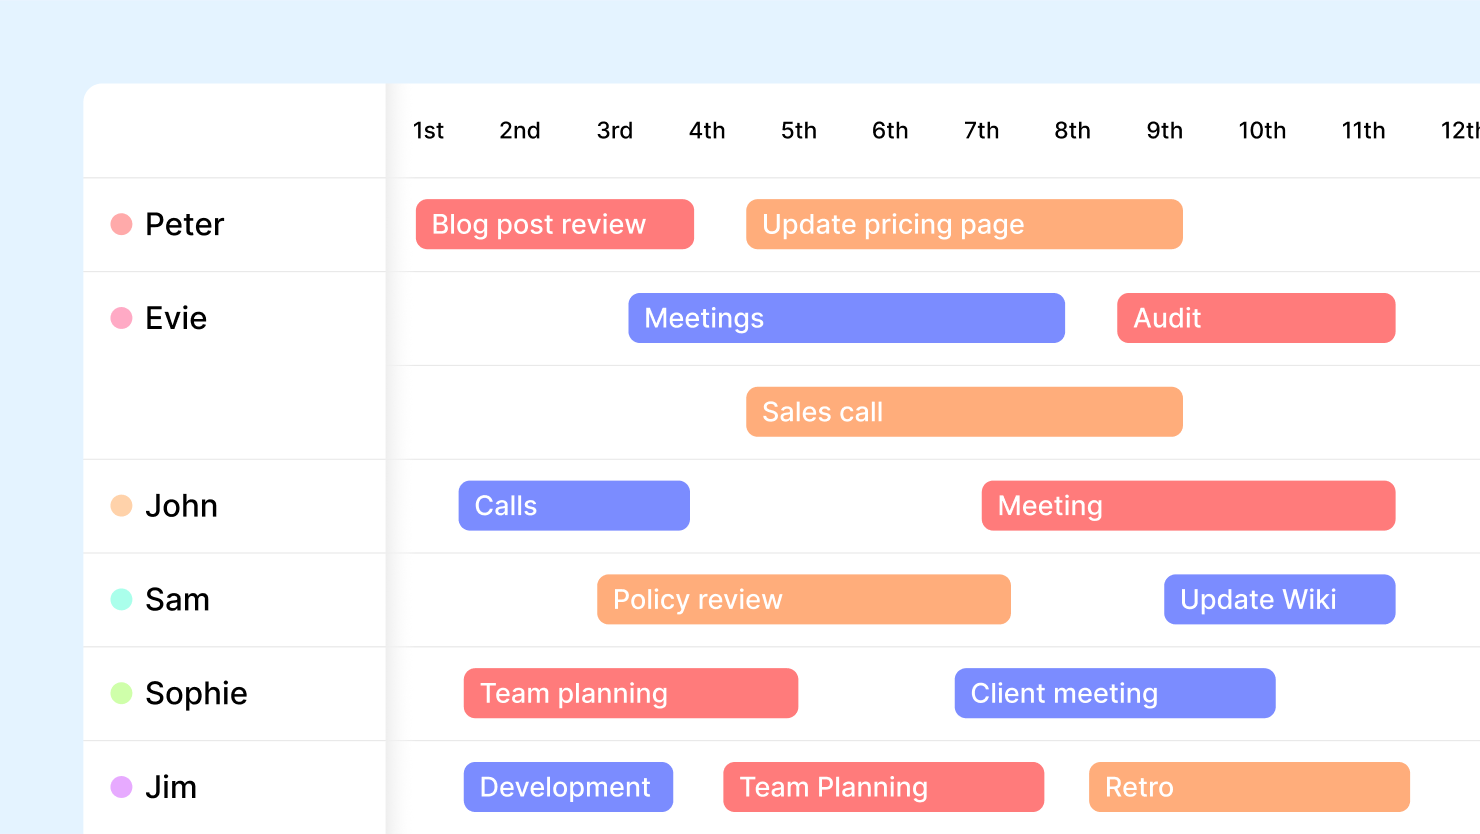
September: Timeline view enhancements
September expanded the My Work feature with comprehensive timeline capabilities.
Enhanced timeline view
The My Work timeline view now supports:
- Grouping by projects for organised task visualisation
- Dependency viewing to understand task relationships
- Filtering for completed, non-completed, or all tasks
- Heatmap visualisation per project
Bulk paste column values
For users working with inline editing, the ability to bulk paste column values significantly accelerates data entry and modification tasks.
Parent user field filters
Record filters can now be applied to parent user fields, enabling more sophisticated permission and visibility configurations.
Q4 2025: Collaborative documentation and advanced analytics
The final quarter of 2025 delivered features that transform Gridfox into a comprehensive platform for documentation, collaboration, and data analysis.
October: Introducing the Docs view
October marked the launch of our collaborative documentation capabilities.
The new Docs view
The Docs view introduces a dedicated space for creating, editing, and collaborating on documentation directly within Gridfox. With real-time collaborative editing, teams can work together on documents simultaneously, eliminating version conflicts and ensuring everyone accesses the most current information.
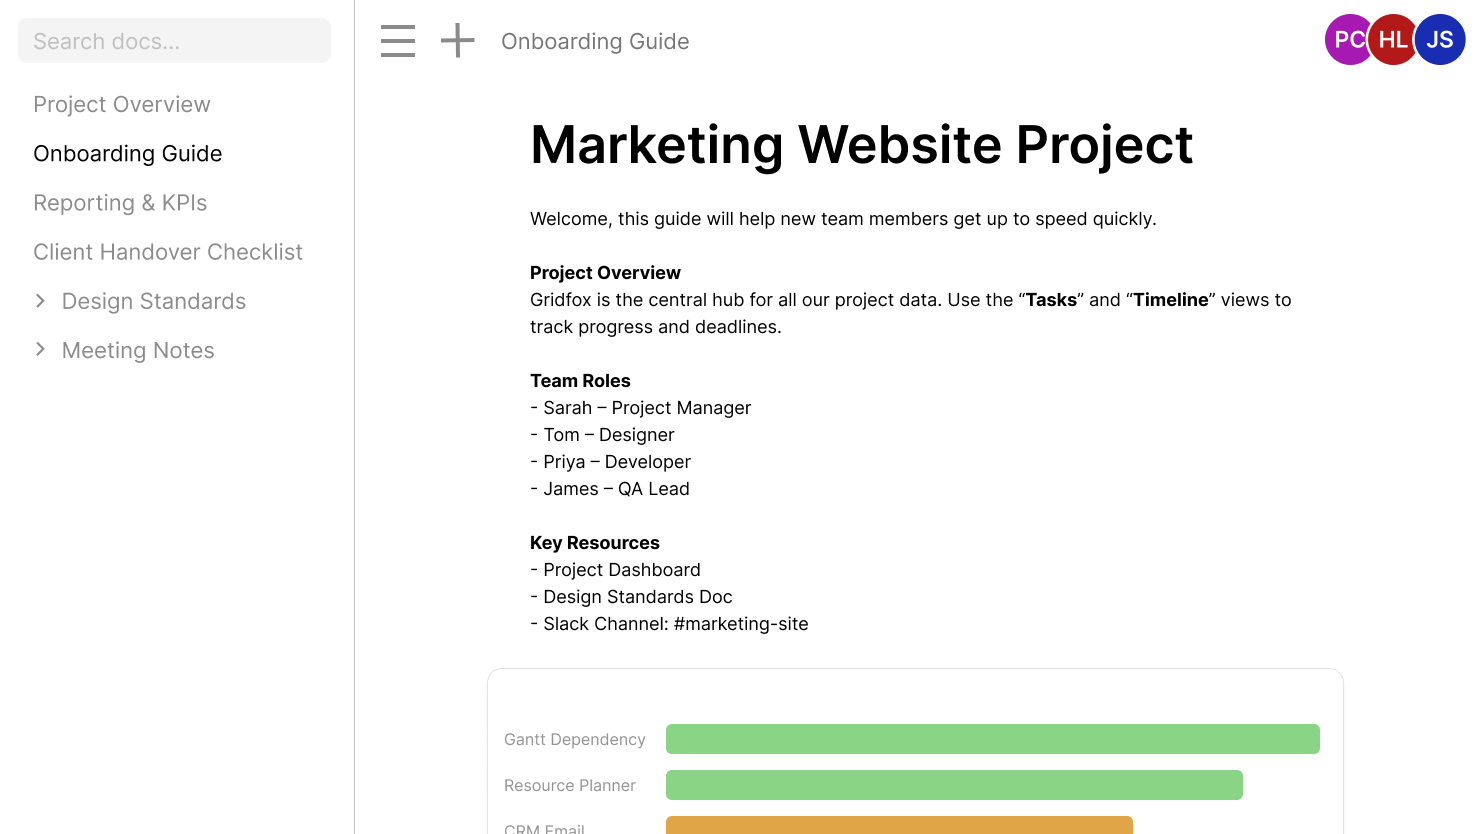
This feature positions Gridfox as a unified platform for both structured data management and unstructured documentation, reducing the need for separate documentation tools.
Filter record workflow trigger
A new workflow trigger type enables automations to execute based on filter conditions, providing additional flexibility in workflow design.
Stripe payments portal
Administrators can now access the Stripe payments portal directly from Gridfox to review historical payment information and manage subscription details.
November: Workflow transparency and template accessibility
November focused on workflow visibility and streamlined project creation.
Task grouping on timeline
The timeline view now supports task grouping, enabling users to organise their workload by custom criteria for improved planning and prioritisation.
Document management improvements
The Docs view received the ability to duplicate pages, accelerating the creation of similar documentation.
Templates in project creation
The “Create new project” dialogue now includes direct access to templates, making it easier for users to begin new projects from proven structures.
Workflow logs
We introduced the ability to view workflow logs, providing administrators with complete transparency into automation execution history. This feature enables troubleshooting, audit compliance, and workflow optimisation based on actual execution data.
December: Pivot tables arrive
The year concluded by delivering long-awaited pivot table functionality.
Pivot table view
Pivot tables enable sophisticated data analysis directly within Gridfox, allowing users to summarise, group, and analyse large datasets without external tools. This feature is particularly valuable for:
- Financial reporting and analysis
- Sales performance summaries
- Resource utilisation reports
- Cross-functional data comparisons
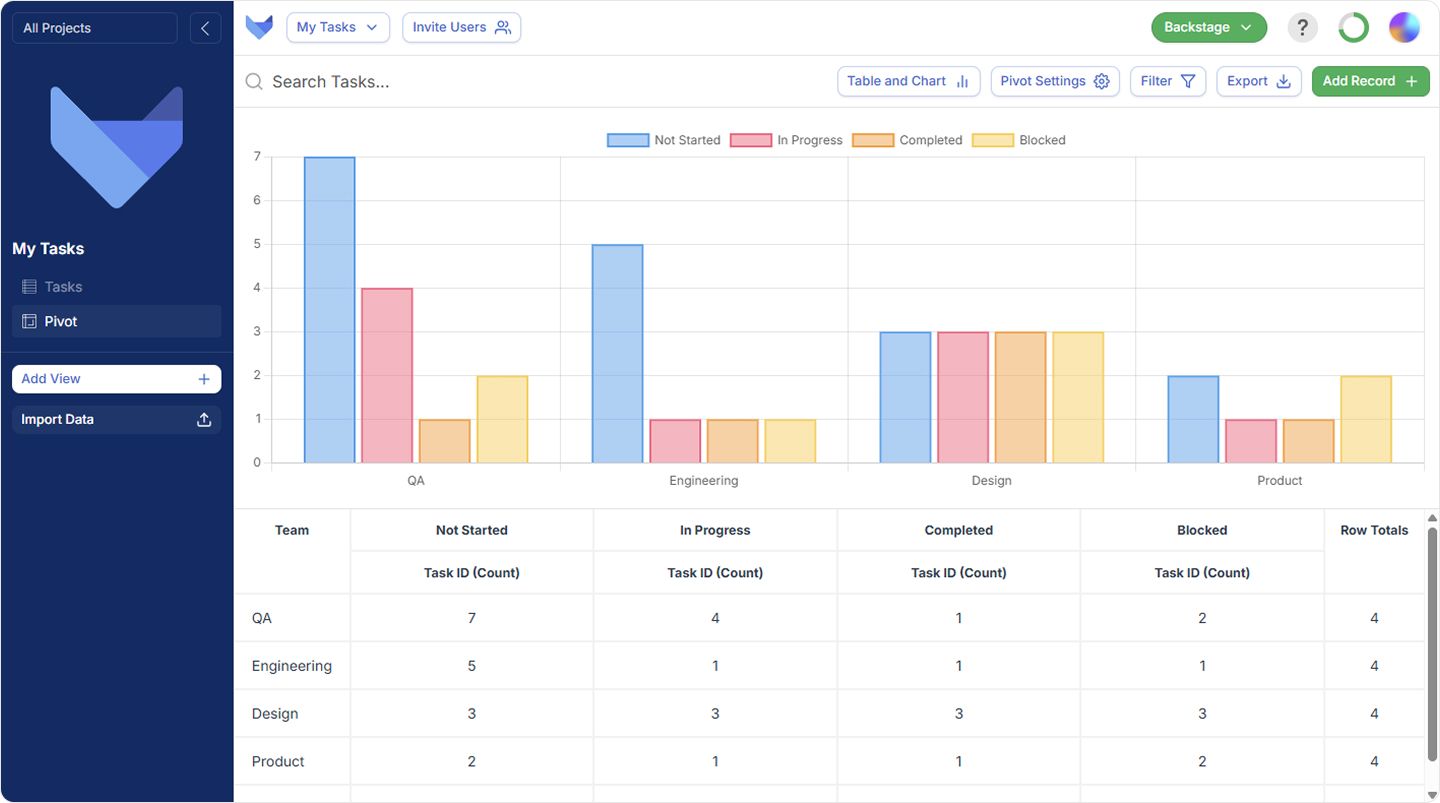
Heatmap visualisation
Pivot tables support three distinct heatmap modes:
- Row-wise heatmaps: Compare values across each row
- Column-wise heatmaps: Compare values within each column
- Table-wise heatmaps: Compare all values across the entire pivot
Chart integration
Users can configure charts directly on pivot table data, combining the summarisation power of pivot tables with visual chart representations.
Key themes of 2025
Reflecting upon the year’s developments, several consistent themes emerge:
Enhanced visualisation and analytics
From Gantt chart milestones to pivot tables, 2025 focused on providing organisations with more powerful methods to visualise, analyse, and understand their data.
Formula and calculation power
The expansion of formula functions, the IF conditional, and substantial performance improvements position Gridfox as a platform capable of sophisticated data processing and automation.
Resource management
The My Work feature and timeline enhancements demonstrate our commitment to helping individuals manage their workload effectively across complex, multi-project environments.
Collaborative documentation
The Docs view introduction establishes Gridfox as a comprehensive platform for both structured data and collaborative documentation.
Performance at scale
Multiple releases focused on performance optimisation, ensuring Gridfox remains responsive as your organisation’s data and complexity grow.
Looking ahead to 2026
As we enter 2026, our development roadmap continues to focus on delivering features that help small and medium-sized enterprises operate more efficiently. We remain committed to our core principle: providing powerful, flexible work management capabilities without requiring technical expertise to implement or maintain.
We extend our sincere gratitude to every customer who has provided feedback, reported issues, and contributed to shaping the platform throughout 2025. Your insights directly influence our development priorities, and we look forward to another year of collaborative improvement.
Frequently asked questions
What was the most significant feature released in 2025?
The cross-project relationships feature, introduced in May 2025, represents arguably the most transformative capability of the year. This feature enables organisations to connect data across previously isolated projects, fundamentally expanding how Gridfox can model complex organisational relationships.
How do I access the new My Work feature?
The My Work feature is accessible from the top-right dropdown menu by selecting “Show my Work.” This displays all tasks assigned to you across all projects to which you have access.
Are pivot tables available on all pricing plans?
Pivot tables are available to all Gridfox users. For specific feature availability on your current plan, please refer to our pricing page or contact our support team.
Can I migrate my existing data to use cross-project relationships?
Yes. Cross-project relationships can be established between existing tables in different projects. Our support documentation provides step-by-step guidance for configuring these relationships.
How can I create a project template from my existing project?
Navigate to your existing project, access the project settings, and select the option to save as template. Your project structure will then be available for use when creating new projects.
Where can I view workflow execution logs?
Workflow logs are accessible from the workflow management section within project settings. These logs display execution history, status, and any errors encountered during automation processing.